Web Attack Forensics - Drone Alone |TryHackMe
Introduction
In this TryHackMe Advent of Cyber 2025 room, I investigated suspicious activity targeting TBFC’s drone scheduler web application. The Apache web server was receiving unusually long HTTP requests containing Base64-encoded payloads. Security monitoring in Splunk generated alerts indicating that Apache had spawned unexpected system processes.
Objectives
- Detect and analyze malicious web activity through Apache access and error logs
- Investigate OS- level attacker actions using Sysmon data
- Identify and decode suspicious or obfuscated attacker payloads
- Reconstruct the full attack chain using Splunk for Blue Team investigation
Key Concepts Learned
Command Injection Attack ( Shell Injection)
Command Injection is a web application vulnerability that allows attackers to execute operating system commands on the underlying server. This typically occurs when a user input is improperly validated and passed directly into system-level commands. In this lab, attackers attempted to exploit a vulnerable script through crafted HTTP requests containing malicious commands.
PowerShell Invoke Expression
Invoke-Expression (IEX) is a PowerShell command that evaluates and executes strings as code. Attackers commonly abuse it to execute malicious payloads locally or remotely while obscuring their true intent. This command is often treated as a high-risk indicator during investigations due to its frequent use in malware and post-exploitation activity.
Reconnaissance vs Enumeration
Reconnaissance is the initial phase of an attack where information about the target environment is gathered. The goal is to identify systems, services, and potential attack surfaces.
Enumeration involves extracting more detailed information about identified assets, such as usernames, hostnames,shares, services, and privilege information. Attackers often perform enumeration immediately after gaining access to validate privileges and identify lateral movement opportunities.
Tools Used
Splunk
A data platform that collects, indexes, searches and analyzes large amounts of machine generated data from various data sources and transforms it into dashboards and other visuals that can be used to gain actionable insights. Splunk was used to identify suspicious web activity and reconstruct the attack timeline.
Sysmon
A Windows system service and device driver that monitors and creates detailed logs of events such as file creation and modification, command -line execution, network activity and other processes.
Investigation Walkthrough
- Detect Suspicious Web Commands
index=windows_apache_access (cmd.exe OR powershell OR "powershell.exe" OR "Invoke-Expression")
| table _time host clientip uri_path uri_query status
The investigation began by reviewing Apache access logs for evidence of command injection attempts.The query instructs Splunk to search the Apache Access logs collected from a windows server for events relating to Windows Command prompt, powershell or a powershell executable( cmd.exe, powershell.exe or invoke expression) and displays the results in table.
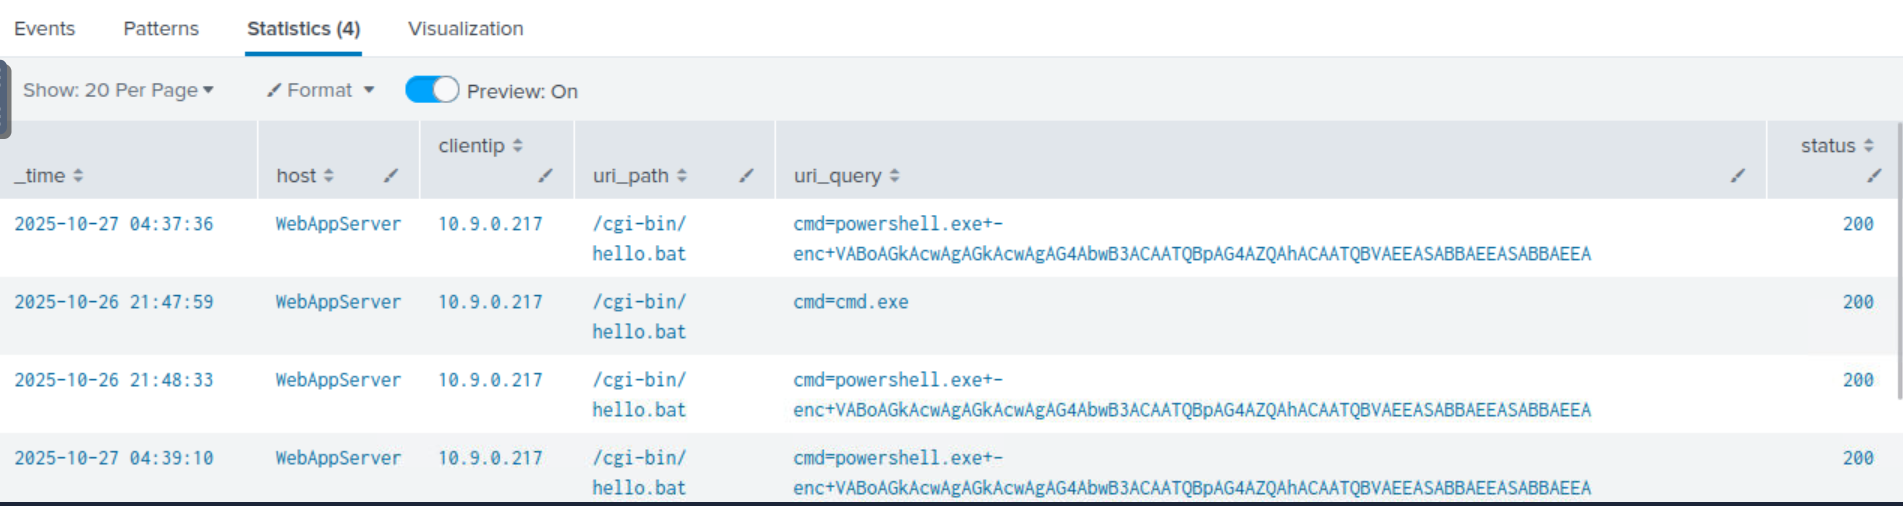
The search revealed multiple suspicious HTTP requests containing references to cmd.exe, powershell.exe and Invoke-Expression. These indicators suggested that the attacker was attempting to execute system-level commands through the vunerable web application. The URI query strings also contained unusually long Base64-encoded data, indicating possible obfuscation attempts designed to evade detection.
Decode Base64
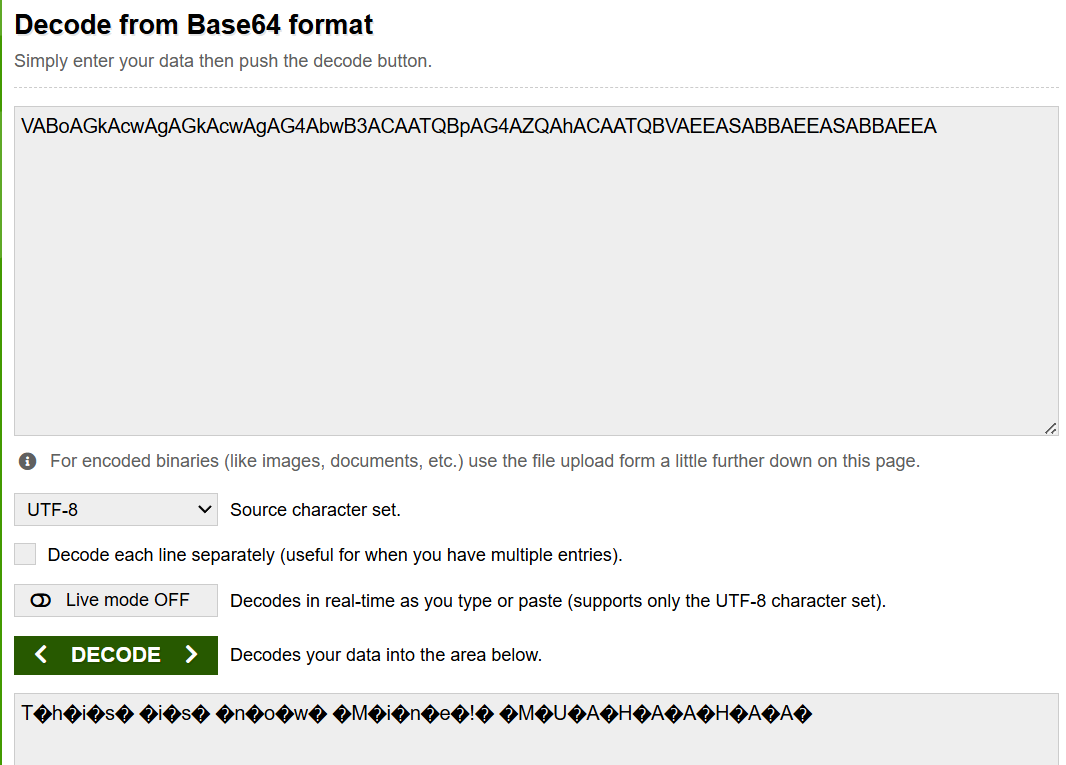 After identifying suspicious requests in the Apache access logs, the Base64-encoded payloads embedded within the HTTP requests were extracted and decoded for further analysis to determine the actual commands being executed by the attacker.The Base64 encoded script was decoded using base64decode.org
Looking for Server-Side Errors or Command Execution in Apache Error Logs
index=windows_apache_error ("cmd.exe" OR "powershell" OR "Internal Server Error”)
To determine whether the malicious requests successfully reached the backend, apache error logs the splunk query above was ran.
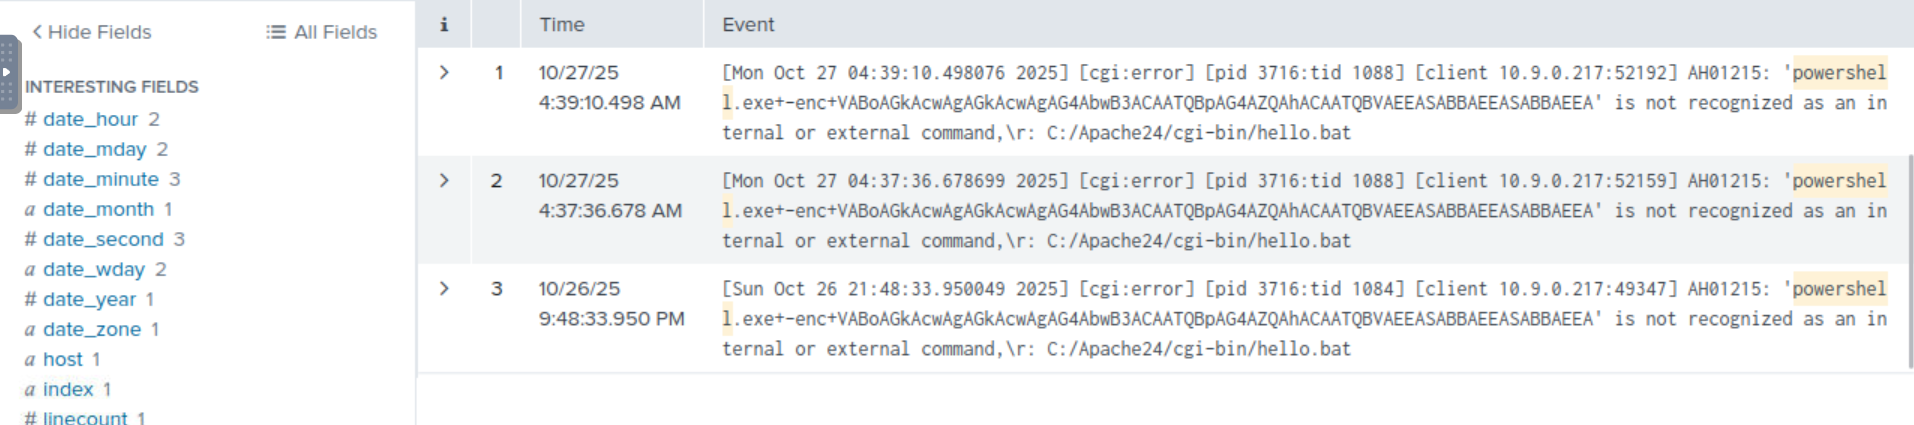
Explanation: The query inspects the Apache error logs from a windows server for internal failures or signs of execution attempts that could be as a result of malicious requests. It means that the attackers input was processed by the server but failed during execution. it confirms if the injection attacks reached the back end of the server or remained blocked on the web layer.
Internal Server error is usually associated with server sides crashes or script failures.
Trace Suspicious Process Creation From Apache
index=windows_sysmon ParentImage="*httpd.exe"
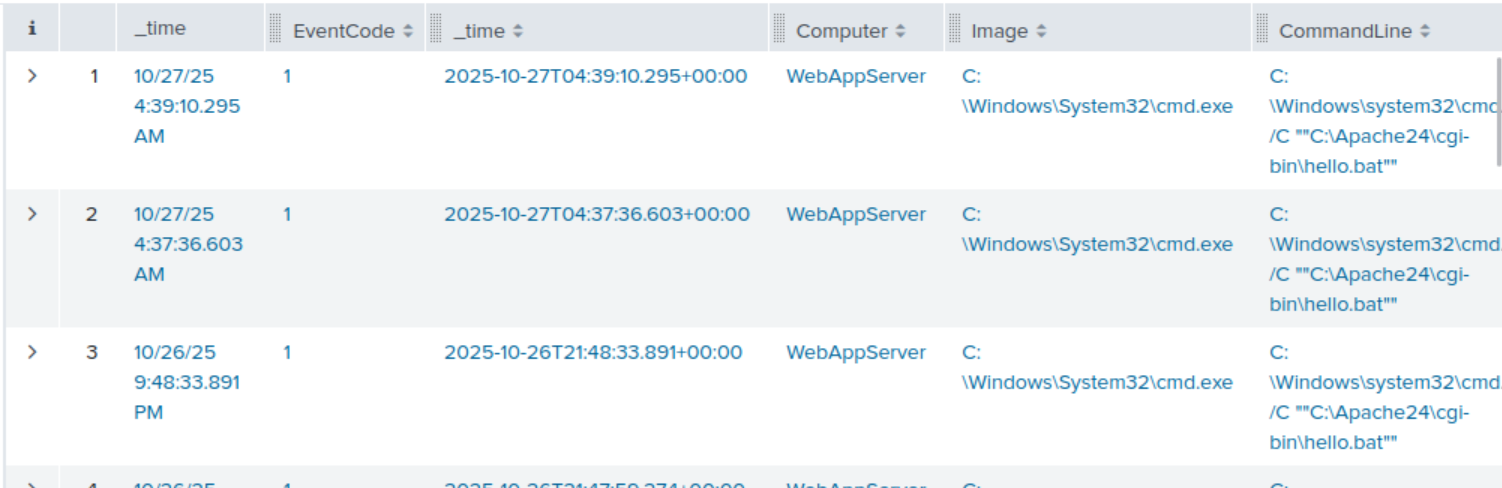
Explanation: Explore sysmon for the processes that were created by apache. Apache is a webserver hence it should not spawn system processes like cmd.exe or pwershell.exe. If Apache has child processes that include system commands , it is an indicator of a successful OS command injection.
Confirm Attacker Enumeration Activity
index=windows_sysmon *cmd.exe* *whoami *
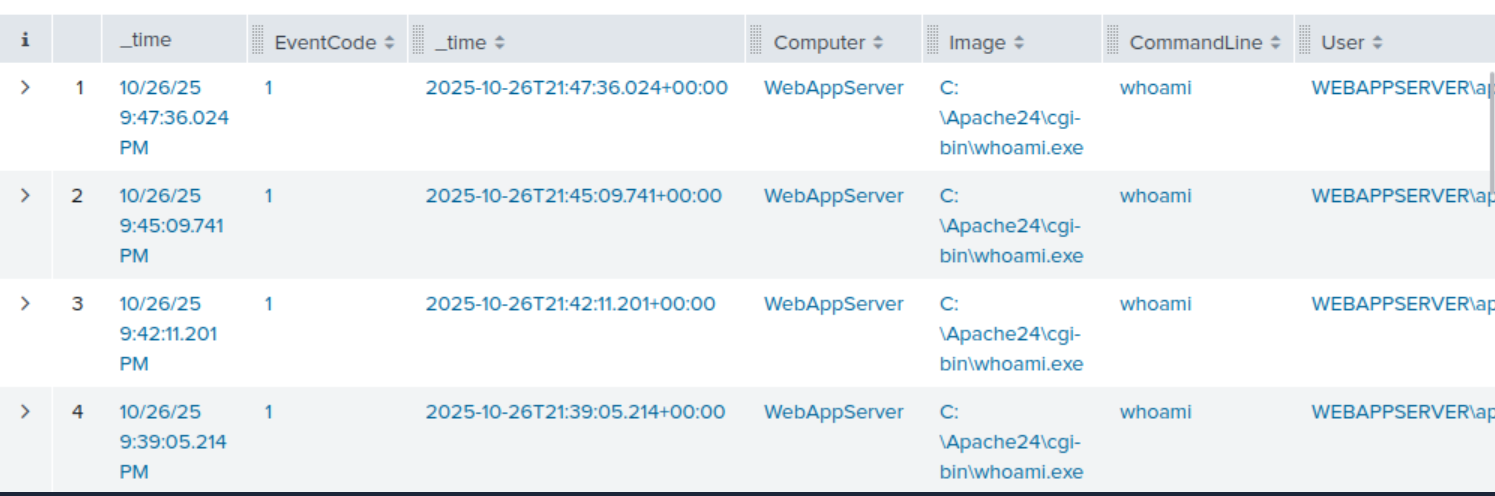
Explanation: The query searches the windows sysmon logs for that contain cmd.exe and whoami . whoami is a command usually run post exploitation reconnaisance. It helps attackers know the current user and its privilege level and confirms if they have system access.
Identify Base64-Encoded PowerShell Payloads
index=windows_sysmon Image="powershell.exe" (CommandLine="enc" OR CommandLine="-EncodedCommand*" OR CommandLine="Base64")
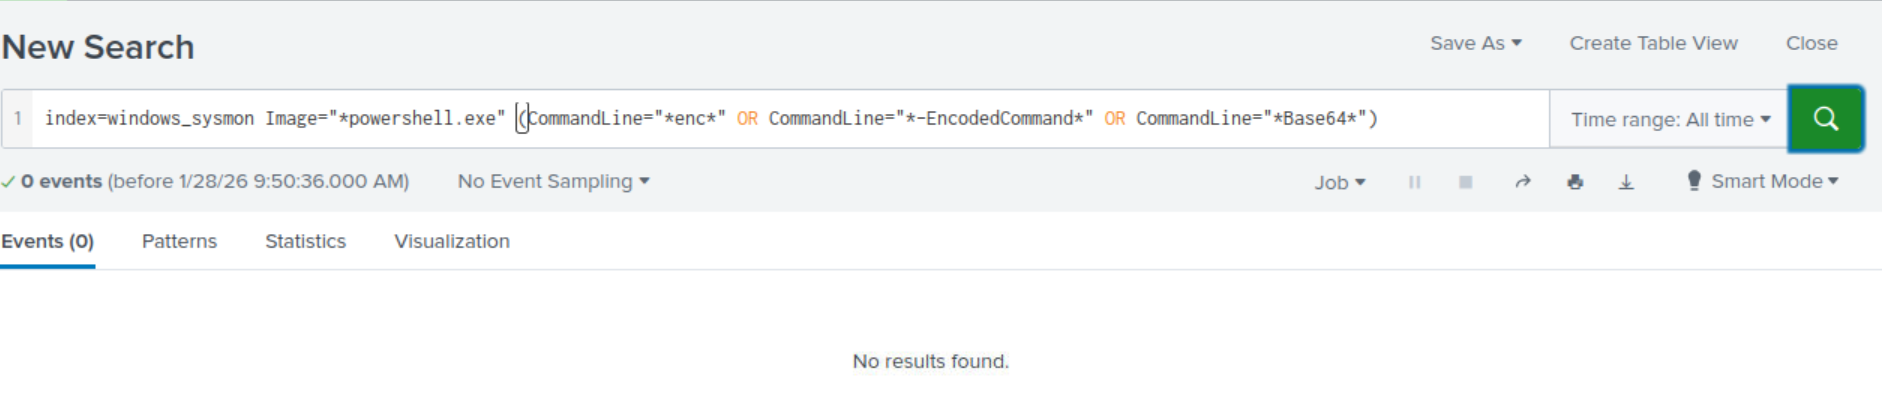
Explanation: Next step is to identify all successfully encoded commands. Attackers use base64 to encode or hide their real commands
The query shows no results meaning that the encoded payload never run.
The query searches the sysmon logs from the Windows server for PowerShell executions that use encoded or Base64 related command-line arguments.